+86 13638632902
 Jason@cleanroomequips.com


 MENU
MENU
Prior to putting in place a 20% reduction in energy waste within the iso 5 cleanroom, the first step is measurement of the HVAC consumption figure, discover if there is an unnecessary airflow, and the efficiency of fan usage without compromising cleanliness of the room. In the end, the real savings will depend on how well you performed beforehand and on the nature of the processes you are carrying out. The implementation of the recommendations made in the text should not violate the cleanliness requirements. In this article, the author specifies the potential for optimization and ways to verify energy savings konstant on the iso 5 level.
The Real Waste Isn't "Cleanliness"
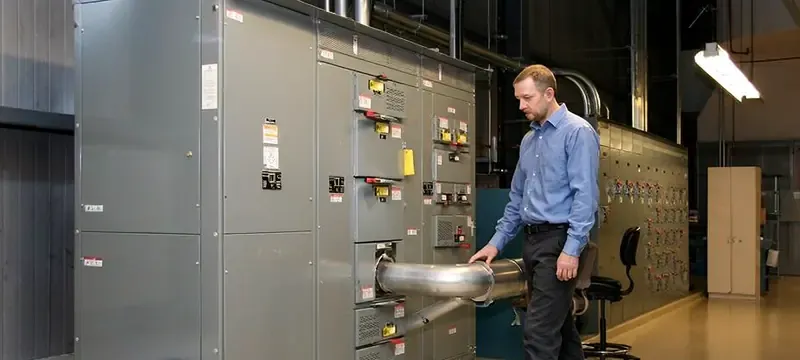
Figure 1: Energy loss in ISO 5 cleanrooms
With ISO 5 compliant cleanrooms, as energy costs rise, intelligent airflow is rethinking "clean" is energy defined by maximum airflow. Often ISO 5 compliant cleanrooms with airflow controlled HVAC systems waste energy at a nominal load, like when production has stopped and particles are still below the threshold.
Not every project can reduce energy consumption by 20%. For projects with ISO 5 compliance, 20% is a reasonable estimate.
The principle is load management, and don't rely on design estimates to measure airflow against the particle risk, need for production, and downtime. Manage the fan as well as the system for pressure, filter burden, temperature, and humidity. Reduce energy at each control step, and automate fallback. Verify compliance with the data.
In ISO 5 cleanrooms, the primary loss points are identified as fans, cooling, reheating, filtration, and exhaust losses as indicated in Figure 1.
What are the actual requirements?

For iso 14644, the classification of cleanliness is based on the concentration of particles, and there is no specified minimum/maximum limit regarding air changes.
Cooling load and cleanroom classification depend on heat load from the process, equipment, personnel, and their behavior; air flow patterns, recovery time, temperature and humidity, pressure differentials and exhaust, and applicable regulations and internal quality systems.
Three typically confused ideas include:
- Classification limit = Cleanroom requirement is based on concentration of particles
- Operational parameters = airflow, velocity, pressure, temperature, and humidity
- Verification state = construction is finished, equipment is at rest, operational tests are performed
There is a significant difference between an ISO 5 semiconductor fab, an optics lab, and a sterile fill line. Semiconductor projects may focus on particle filtration, heat load, and local exhaust. Optics labs may focus on temperature control and surface contamination. However, all Pharma projects must also consider the process and their regulatory compliance to contamination control.
Where Does ISO 5 Energy Actually Go?
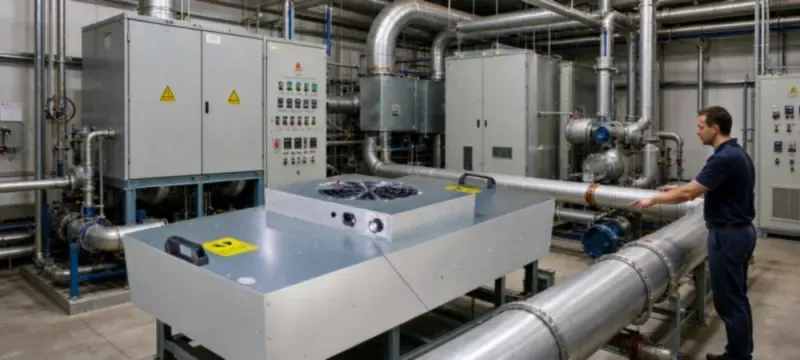
Energy for fans
Moving large volumes of air in a system means working against the resistance of the HEPA/ULPA filters, losses in ducts and bends, losses due to dampers, resistance in the supply/return paths, and pressure drops across terminal devices. In many systems, the relationship is non-linear. A small reduction in speed can translate to a large reduction in power consumption, though this should be verified in the field.
Cooling, dehumidification, and reheat
Increased airflow imposes a higher cooling, dehumidification, and reheat burden, in addition to the increased duty on the fans. Looking at the fan power alone results in underestimating the real savings.
High air pressure and leaks
When pressure setpoints are higher than required by the process, clean air leaks through cracks, makeup air systems are needed, the air control doors become more difficult to move and there are greater fluctuations in inter-room pressure, causing greater loads on the fans.
Increasing resistance from filters
As dust accumulates on filters, the pressure drop increases. If filters are replaced on a set schedule instead of tracking the pressure changes and assessing the fan power, there is both an early filter change (cost) and a late change that results greater fan power and instability in the system.
Hidden waste caused by fixed control strategies include:
- Full load during non-working hours
- No reaction after a fall in particulate load
- Same target for greater number of zones
- No control upon reading data; only presence of alarm
- No dependency of fans to the state of process equipment
- Adjustment done manually at every deviation
Case Study: David's Turf War Between Compliance and Energy Consumption

David is the Facility Manager for a precision optics company. His responsibilities consist of managing a production space of approximately 2000 m², several ISO 5 control zones, the plant's HVAC system, the Building Management System, and compliance of cleanrooms. He must also consider the system's annual operational cost (energy) and reliability of equipment.
The problems that he faces with the current situation in the plant are: post-shift production is low control of particulate matter in the air is high. Finance wants reduced electric consumption. Quality is concerned about control of particulates. The system is unable to provide any feedback. David is also unable to assess control waste for the fans, cooling and pressure control. He is also unable to shut the system down for any length of time to do retrofits.
David's potential search terms may include:
- iso 5 clean room energy consumption reduction
- ISO 5 room change rate air control optimization
- smart airflow control in clean rooms
- energy savings in clean rooms without loss of compliance
- green clean rooms retrofit ROI
If David cannot lower cleanroom classification and cannot absorb a production loss, through which variable should cleanroom retrofit costs be controlled greater - Control techniques or equipment? The answer is to first put a controlled, reliable foundation in place, and then control techniques and equipment should be prioritized.
Step 1: Create a reliable ISO 5 Energy Baseline
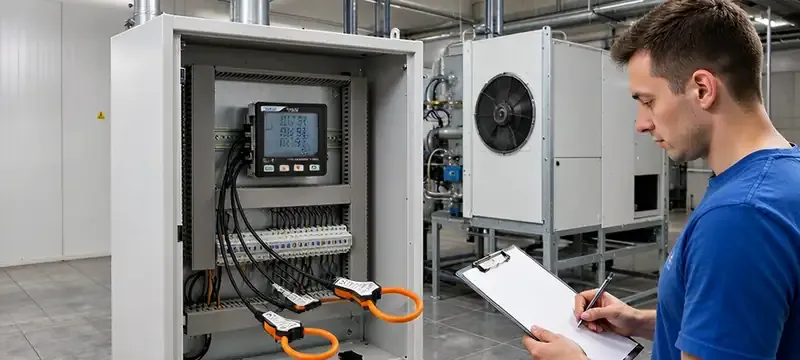
Without a measure, one does not know if savings would be attained from Control Optimization, if production would have to be changed, if Air Flow might be reduced with no impact to Cleanroom Class, if a Zone is being supplied with 100% airflow, and if savings of 20% could be made on a consistent basis.
Data to collect:
- Fan power, frequency, and time of operation
- Airflow velocity and air change performance
- Room pressure level differences
- Trending particle counts
- Temperature and RH
- Filter DP
- Production and occupancy data and door status
Measure in a way that is proportional to the risk involved. The baseline period must include what is considered normal production, peak periods, low-load operation, as well as the shutdown and cleaning periods.
Risk map by zone
- Critical process areas
- Support zones
- Personnel or material corridors
- Low-occupancy areas
- Zones that can be adjusted during non-production
Temperature and air quality monitoring initialize a specific response for a manufacturing area. Do not constrain flow uniformly. Control based on risk of contamination for each zone and the mode of production.
CFD airflow simulation before airflow reduction
One of the biggest fears when lowering airflow is the development of dead zones, that is areas where the laminar flow boundary layer breaks down and particles accumulate. The Deiiang™ team uses CFD simulations in critical air subsystem zones to reduce airflow based on need.
In a typical ISO 5 precision optics cleanroom, the baseline downflow velocity is approximately 0.45 m/s. These simulations also see that the core process zone, even with a 15 to 18 percent reduction in supply air, can remain between 0.35 and 0.54 m/s, the safe limits defined by iso 14644-4 for unidirectional airflow. We must keep downflow work plane velocities above 0.35 m/s to avoid stagnant eddies, and below 0.54 m/s to avoid airflow disruption of settled particles.
Before implementing any physical modifications, CFD assists in determining the optimal placement for flow straighteners and the arrangement of supply diffusers. CFD aids in removing the risk of validation test failures and reduces the commissioning time frame by 30 to 40 percent.
Sensor credibility check
Data alone cannot control fans unless the following factors are verified: calibration, proper placement, site representative sampling, the absence of drift or comms loss, BMS alignment for time stamps, and the method for handling outliers.
Deiiang™ has found that in more than 60 percent of the cleanroom pressure control assessment visits, false pressures were caused by low-cost resistive differential pressure sensors, which drift more than ±3 Pa over a year. The BMS control in the drifted range increases the makeup air, therefore wasting the fans and destabilizing the pressure cascade.
Jason's solution? Self-calibrating micro-capacitive sensors with built-in temperature control. They pay off in 6 to 8 months. They cost a little more, but save the energy spent on cooling the overactive sensors.
Step 2: Intelligent Airflow Management, Not "One-Size-Fits-All" Reduction
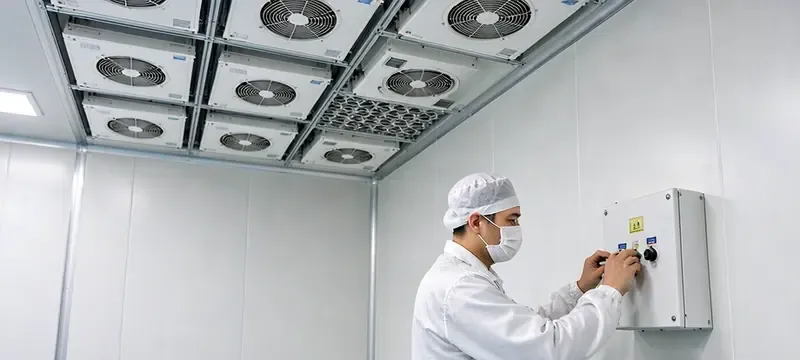
As a closed loop, airflow management processes work as follows: Sense → Analyze → Decide → Adjust → Verify → Auto-fallback.
Inputs can report particle trends, zone occupancy, equipment status, door state, pressure, humidity or temperature levels, filter resistance, and scheduled times. Outputs offer control over dampers and fan speed, supply and return balance, production control, trigger alarms, and validated safe setpoints among other control functions.
Compatibility or integration with existing building management systems.
How often do facility engineers ask, "Will this control integration work with our Siemens, Schneider, Trane, or Johnson Controls BMS?" All our Deiiang™ intelligent control modules are designed for complete integration.
- BACnet IP and MSTP
- Modbus RTU and TCP
- LonWorks (upon request)
- OPC UA (upon request)
The Deiiang™ edge gateway will reside beside your existing building management system control. The Deiiang™ edge gateway will fetch and send validated data for control of airflow on demand. Integration will require no more than a complete rework of a single air handling unit for a period of 2 to 4 days.
From constant airflow control to control based on demand
We are not altering controls for every single minor fluctuation. A reasonable upper and lower limit is defined. Limits for rate of change, debounce and delay logic are included as well as a safe mode in the event of a fault with a control.
VFD Opportunities
Where possible with fan and system characteristics, power demand can be decreased by a factor of five through speed reduction via VFD. However, it must be verified that the fan speed is within the efficient range, that the minimum airflow is adequate for the process, that terminal velocities are adequate, that temperature and humidity can be maintained, that pressure is stable, and that there are no low velocity or stagnation/cross-contamination zones.
Most sites simply set the fan frequency to 25 Hz or less and assume they are saving energy. This can backfire. Reduced frequency reduces the motor's internal fan, causing the motor to overheat and resulting in complete failure of the windings. Additionally, at low frequencies, the VFD generates high order harmonics which can disrupt many modern inspection tools such as laser interferometers and electron microscopes.
Deiiang™ Approach: Set a VFD lower limit (e.g., 35 Hz) and pair with intelligent damper modulation for finer airflow control, with robust damper modulation and line reactors to suppress harmonics. This protects both the motor and the process.
Occupancy-Based Modes
- Production Mode: Maintain protection of the validated process.
- Standby Mode: Reduced protection when low occupancy or low load.
- Recovery Mode: Restore conditions to support production and ensure the conditions of release.
The 100:1 recovery time test, as outlined in ISO 14644-3, is required for any standby mode that decreases airflow. This specifies that the cleanroom should be able to return to iso 5 cleanroom standards within a specified timeframe of 15 to 20 minutes, depending on volume and airflow design, from a challenge of 100× the iso 5 particle count.
Without an approved recovery time test, any standby mode will not be considered a compliant energy-saving measure. Automated recovery performance logging has been built into all intelligent airflow projects, meaning that QA teams will have documented proof that the cleanroom recovers to a satisfactory level before the production activities are restarted.
Auto-fallback will be triggered from insufficient data, shift in the status window, excessive reset time, excessive open door duration, and any equipment failure.
Step 3: Optimize Pressure Gradients, Reduce Ineffective Air Leakage
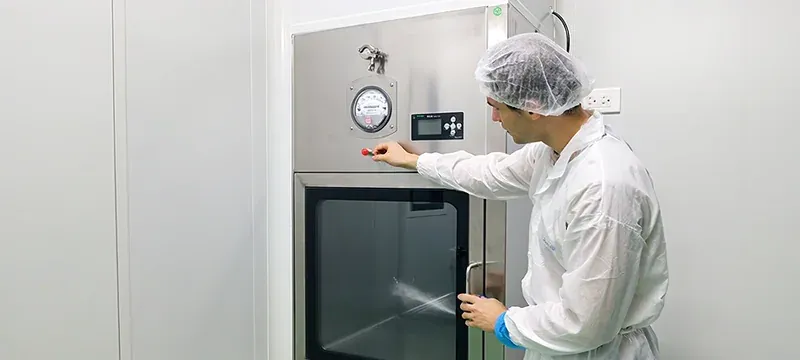
The goal of pressure differentials is to maintain proper airflow direction and contamination control — not to chase the highest possible value.
Diagnose pressure issues
- Is it stable when doors are closed?
- How long does it take to recover after door opening?
- Are there obvious envelope leaks?
- Is supply and return balanced?
- Do adjacent rooms "compete" for airflow?
- Does exhaust equipment startup/shutdown affect gradients?
Optimization methods
- Repair unnecessary building leaks
- Correct door gaps, pass-through boxes, and seal points
- Coordinate supply, return, and exhaust
- Use zoned pressure control
- Optimize setpoints to avoid over-pressurization
- Verify airflow direction under worst-case conditions
Step 4: Include Filter Management in Energy Optimization
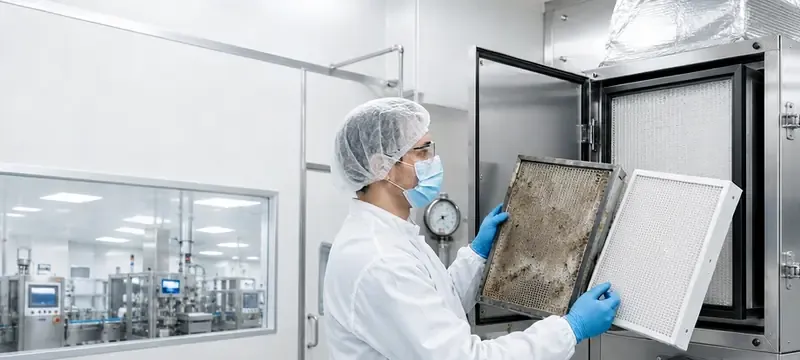
Filters are often treated as a consumable cost issue, but pressure drop directly affects fan load and system stability.
Move from fixed-interval replacement to condition-based assessment using filter pressure trend, fan output changes, cleanliness performance, runtime hours, production contamination load, and integrity testing/maintenance requirements.
Avoid two extremes: running filters beyond their useful life to save consumable cost, and replacing usable filters on a calendar basis.
Jason Peng's Five Insider Tips

Tip 1: Measure actual demand. Don't treat design maximum as the permanent operating setpoint.
Tip 2: Prioritize non-production hours. They usually have lower risk and faster payback, but always verify recovery capability.
Tip 3: Don't look only at the fan meter. Evaluate the combined impact on cooling, dehumidification, reheat, makeup air, and exhaust.
Tip 4: Adjust step by step. Observe particle, pressure, temperature/humidity, and recovery time after each change before taking the next step.
Tip 5: All optimization must be traceable. Keep baseline, risk assessment, parameter change records, trend charts, test results, approvals, and exception/fallback logs.
Common Myths: "Safe" Practices That May Be Wasting Energy
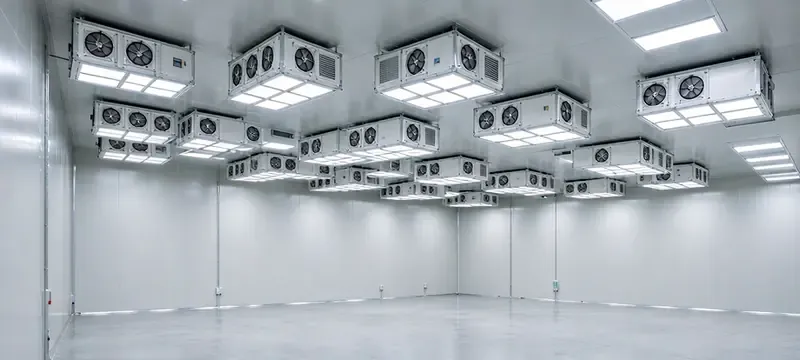
Higher air changes always mean better cleanliness. Not exactly. Cleanliness depends on airflow pattern, source strength, filtration efficiency, local dead zones, and personnel behavior. Beyond actual need, additional airflow brings diminishing returns.
Right approach: Use particle trends, airflow visualization, and risk testing to determine the effective operating range.
ISO 5 requires a fixed ACH for all projects. The classification standard should not be misinterpreted as a mandatory uniform air change rate.
Right approach: Combine process risk, airflow pattern, contamination load, and applicable regulations to determine operating parameters.
Higher pressure means better contamination control. Excessive pressure can increase leakage, door operation difficulty, and system fluctuations.
Right approach: Use a validated, reasonable pressure that maintains the required airflow direction.
Energy saving always sacrifices cleanliness. Unvalidated direct speed reduction carries risk, but data-driven closed-loop optimization can reduce over-operation within a protection envelope.
Installing a smart system automatically saves 20%. Savings depend on original system efficiency, runtime, process load, control strategy, and local energy costs.
Right approach: Establish a baseline, then set project goals and a measurement/verification plan.
Deiiang™ Case Study: ISO 5 Precision Manufacturing Energy Optimization
Project overview
- Region: Southeast Asia (tropical climate)
- Industry: Precision optics manufacturing
- Area: ~1,200 m² of ISO 5 controlled space
- System: Two AHUs with VFDs, fixed-speed operation previously
- Shifts: Two production shifts + overnight idle
- Electricity: ~0.12 USD/kWh (blended industrial rate)
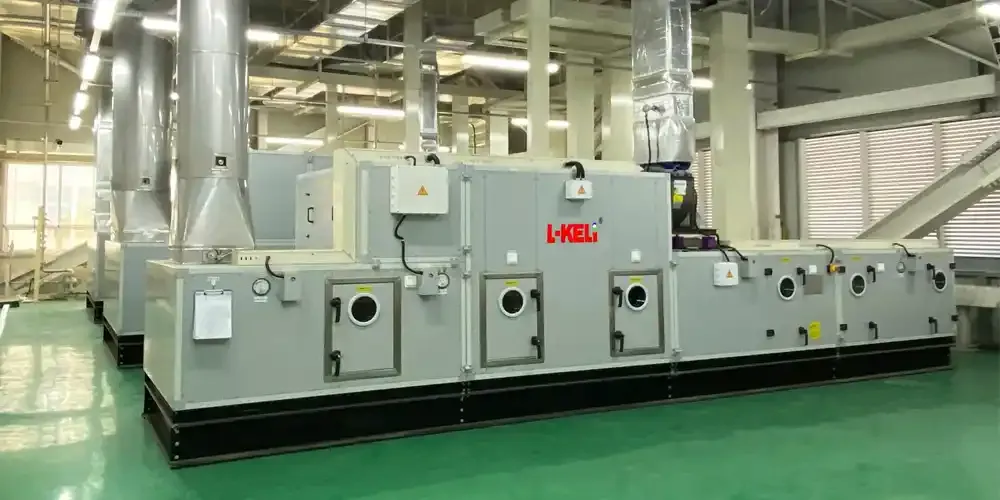
Figure 2: Before optimization — the AHU ran at fixed frequency regardless of production load.
Challenges
- Technical: No zone-level monitoring; airflow and particle data couldn't be correlated; one AHU served multiple rooms; adjusting one zone affected adjacent pressures.
- Production: Short downtime windows; could not affect critical production; post-optimization recovery had to be fast and validated.
- Compliance: Needed proof that energy savings didn't increase particle risk; all parameter changes had to be documented; quality team required test method and result review.
- Local: High humidity drove significant dehumidification load; tropical climate meant high cooling demand; time-of-use tariff influenced operating strategy.
Deiiang™ diagnostic process
- Baseline monitoring: Collected one full production cycle; distinguished production, cleaning, standby, and recovery states; identified high-energy, low-contamination periods.
- Airflow & risk analysis: Analyzed supply/return/exhaust balance; located pressure fluctuations and air leaks; defined optimization boundaries for each zone.
- Control strategy design: Set multiple operating modes; established upper/lower limits; configured auto-fallback for anomalies; integrated key data into the control platform.
- Phased implementation: Piloted low-risk zones first; adjusted fans and dampers step by step; trend-evaluated after each adjustment; then expanded to other zones.
- Testing & validation: Particle counting, pressure stability, temperature/humidity, recovery time, smoke visualization, airflow/velocity, and energy measurement.
Results
| Metric | Before | After | Change |
|---|---|---|---|
| HVAC monthly electricity (kWh) | 142,000 | 114,000 | -19.7% |
| Fan average power (kW) | 48.2 | 37.6 | -22.0% |
| Non-production fan frequency (Hz) | 48 | 36 | -25.0% |
| Room pressure fluctuation (Pa) | ±6.5 | ±3.2 | -51% |
| Particle compliance (ISO 5) | Pass | Pass | Maintained |
| Filter pressure rise rate (Pa/month) | 4.2 | 3.1 | -26% |
| Annual projected savings (USD) | — | ~38,000 | — |
| Metric | Before | After |
|---|---|---|
| HVAC monthly (kWh) | 142k | 114k |
| Fan avg power (kW) | 48.2 | 37.6 |
| Non-prod fan freq (Hz) | 48 | 36 |
| Pressure fluctuation (Pa) | ±6.5 | ±3.2 |
| Particle compliance | Pass | Pass |
| Filter rise rate (Pa/mo) | 4.2 | 3.1 |
| Annual savings (USD) | — | ~38k |
Table 1: Optimisation results — 19.7% HVAC electricity reduction while maintaining ISO 5 compliance.
Beyond energy savings, the project achieved: improved stability, fewer alarms, faster pressure recovery, better data traceability, more accurate maintenance planning, reduced ESG emissions, and less operator workload.
Localization: Optimization Priorities Differ by Region

- Hot & humid: Focus on fresh air dehumidification, cooling-reheat interaction, door-opening moisture load, and seasonal variation.
- Hot & dry: Consider diurnal temperature swings, cooling load, humidification needs, and evaporative cooling potential.
- Cold climates: Address makeup air heating cost, winter low-humidity control, heat recovery opportunities, and excessive exhaust loss.
- High or time-of-use tariffs: Optimize peak/off-peak scheduling, non-critical load shifting, standby start/stop timing, demand charges, and energy storage integration.
ROI: Is the Project Worth It?

Annual energy saving (kWh) = pre-optimization annual consumption × expected savings rate.
Annual cost saving (USD) = annual energy saving × local blended electricity rate.
Simple payback (years) = total project investment ÷ annual net saving.
Don't forget to include: reduced demand charges, filter/maintenance cost changes, less downtime, extended component life, carbon reduction, and automation-driven labor savings.
Cleanroom Energy ROI Calculator
Estimate your potential savings — adjust the sliders or input values below.
Estimated annual savings: $10,117
Estimated annual CO₂ reduction: ~18.2 metric tons (based on 0.4 kg/kWh)
Simple payback (est.): ~14 months (assuming $12,000 investment)
* This is a rough estimate. Actual savings depend on baseline efficiency, load profile, and local conditions.
Implementation Roadmap: From Audit to Continuous Optimization

- Pre-assessment: Collect drawings and BMS trends; confirm cleanroom grade and process states; understand operating schedule and energy bills.
- On-site diagnosis: Measure actual power and airflow; check sensors; assess pressure and leakage; build a risk zone map.
- Design & simulation: Develop control logic; set safety limits; run airflow simulations if needed; define validation and fallback plans.
- Pilot: Choose low-risk zones; make small stepwise adjustments; continuously log key parameters; joint review by quality and engineering.
- Rollout: Replicate validated strategies to similar zones; adjust special zones individually; train operations and maintenance staff.
Change Control & Re‑qualification — the compliance backbone
In highly regulated industries (pharma sterile fill, advanced semiconductor), any HVAC parameter change must follow a formal change control process. Deiiang™ embeds these steps into every project:
- Risk Assessment (RA) — Identify potential impact on product quality, operator safety, and regulatory compliance. Use FMEA or HAZOP tools.
- Change Request (CR) — Submit formal CR with technical justification, baseline data, and proposed new setpoints. Include QA, Engineering, and Operations sign-off.
- Re‑qualification (DQ / IQ / OQ / PQ) — Execute dynamic particle testing, pressure differential verification, airflow visualization, and recovery time tests per ISO 14644‑3. Document all results.
- SOP update & release — Revise standard operating procedures, train operators, and obtain final release from Quality Assurance before the new mode becomes permanent.
- Continuous verification: Monthly energy reviews; seasonal parameter reviews; sensor calibration; filter trend assessment; re-evaluate after production changes.
When Not to Reduce Airflow Immediately
- Particle counts are already near the control limit
- Pressure differentials are chronically unstable
- Sensors are uncalibrated or data is missing
- There are obvious dead zones in airflow
- Recent major process changes
- Filter or fan malfunctions
- Change control not completed
- Unable to schedule necessary testing and validation
- Applicable regulations or client specifications do not permit direct adjustment
In these cases, address infrastructure or data quality issues first.
FAQ — Long-tail search coverage
What is the biggest source of energy waste in an ISO 5 cleanroom?
The combination of fans, air treatment, and over-operation. The exact breakdown varies by project, but fixed-control strategies often dominate.
Can an ISO 5 cleanroom reduce airflow during unoccupied hours?
Yes, with risk assessment and validation. Recovery time, pressure, temperature/humidity, and particle conditions must be verified.
Does ISO 14644 specify a fixed air change rate for ISO 5?
No. Classification limits are separate from design operational parameters.
How does intelligent airflow management save energy?
Through a closed loop: sense, analyze, adjust, verify — reducing over-supply while maintaining protection.
Will lowering fan speed affect HEPA filter performance?
It depends. Verify airflow, terminal velocity, pressure differential, airflow pattern, and filtration system design.
How much energy can an ISO 5 cleanroom save?
It depends on the baseline, runtime, climate, process load, and original control level. 20% is a project target or specific case result, not an unconditional guarantee.
How long does an airflow optimization project take?
It varies by assessment, monitoring, pilot, validation, and rollout phases. A typical project ranges from several weeks to a few months.
What data does Deiiang™ need for an initial assessment?
System drawings, fan/AHU parameters, BMS trends, particle and pressure records, operating schedule, energy bills, and recent validation reports.
How is energy saving verified?
By comparing baseline period data with post-optimization data, normalizing for variables, and using independent metering with continuous trend monitoring.
Can the system return to full airflow automatically?
Yes. Anomaly triggers, auto-fallback, and alarm mechanisms are built into the control logic.
Conclusion
ISO 5 energy optimization is not about simply reducing airflow. The real opportunity lies in identifying over-operation. Intelligent airflow management requires reliable sensing, risk-based boundaries, and validation. A 20% reduction target must be proven with project baseline and actual data.
References
- iso 14644-1:2015 — Cleanrooms and associated controlled environments, Part 1: Classification of air cleanliness by particle concentration
- iso 14644-3:2019 — Test methods (including recovery time test)
- ISO 14644-4:2022 — Design, construction and start-up
- ASHRAE Handbook — HVAC Applications, Chapter 18: Clean Spaces
- U.S. DOE — Energy Efficient Cleanrooms
- EN 1822 — High efficiency air filters (HEPA and ULPA)
© 2026 Deiiang™ · Product design by Jason Peng · All rights reserved.