+86 13638632902
 Jason@cleanroomequips.com


 MENU
MENU
The cleanroom having a less initial cost does not mean it will have a lesser cost in the long term . A ten years analytical overview , known as a life cycle cost analysis includes capital investment, expenses on energy consumption, replacing filters, maintenance, testing, cleaning, repairing, labour and downtime costs . As due to HVAC and air conditioning systems costing the most when operational expenses of clean rooms are accounted for, it is always possible to modernize the design of the systems so that it ensures maximum efficiency . Guidelines below contain information about principles of comparing various options for cleanroom design depending on the total cost of ownership as well as compliance and operational efficiency .
The Hidden Cost of Cleanroom Ownership
Many cleanroom project budgets consider only construction costs (CAPEX). This evaluation neglects the far more significant cost of carrying the operating expenses of the facility for its expected lifecycle.
Data published variously in the industry reveals that the cumulative cost of ten years of operations (OPEX) will be between three to five times the CAPEX. In the case of a cleanroom with a CAPEX of $2 million, the total cost of ownership will exceed $8 million to $10 million before any significant refurbishing.
Hidden costs are real and significant. They come in the form of monthly power bills, quarterly costs for new filters, contracts for annual validations, and loss of output from equipment that has to be shut down to service or repair.
Key Insight: A cleanroom that costs 15% more to build can cost 40% less to operate over 10 years. The cheapest tender rarely delivers the lowest total cost of ownership.
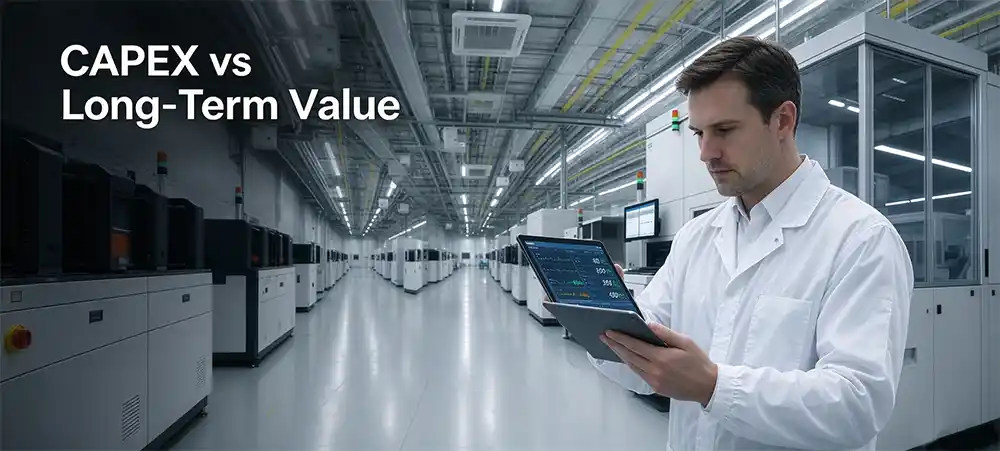
Initial Investment (CAPEX) vs. Long-Term Value
Lower CAPEX results from selecting lower grade filters, wall panels, and basic ffu units. Those choices result in lower initial costs, but the cleanroom's total cost of ownership will be more because maintenance and energy costs will be much higher.
For instance, an FFU with a lower efficiency motor may cost $80 less to purchase. However, if the cleanroom has 200 FFUs that operate 8,760 hours in a year at $0.12 per kWh, the cost of operating the cleanroom will be over $25,000, completely erasing the purchase price savings.
Likewise, lower cost pre-filters will not be costless. They will require replacement more frequently, and the cost of doing that will increase because of a greater pressure drop resulting in a greater energy cost that will continue until the system is replaced.
The 10 year cash flow must be accounted for in the ROI of the cleanroom when weighing the construction cost. The construction cost of a cleanroom that is built to a higher standard typically pays for the construction cost within three to five years, due to decreased energy and maintenance costs.
Engineering Pitfall: The Safety Margin Trap
Many design firms incorporate a 20–30% buffer for safety factors toward heat load and airflow. This causes AHUs and chillers to operate between 30–40% load, where efficiency plummets. Deiiang uses CFD simulation to assess actual loads, preventing the installation of undersized equipment that operates inefficiently for a prolonged period.
Beyond the obvious cost savings, the design of energy-efficient cleanrooms helps ACHieve a company’s ESG goals. The HVAC system directly reduced Scope 2's carbon emissions by lowering energy consumption by 35%. For multinational pharmaceutical and semiconductor manufacturers, this is not just about saving on electricity bills. It can also make companies' environmental data look better and make it easier for them to achieve their carbon reduction goals.
Breaking Down Cleanroom Maintenance Costs
Well designed systems have predictable cleanroom maintenance costs. However, maintenance costs can increase markedly due to poor design. The four greatest recurring cost factors are:
- Filter replacement frequency — HEPA/ULPA filters and pre-filters require periodic replacement; low-grade media shortens service life.
- FFU energy consumption — fan-filter units run continuously; motor efficiency and pressure drop directly determine kWh usage.
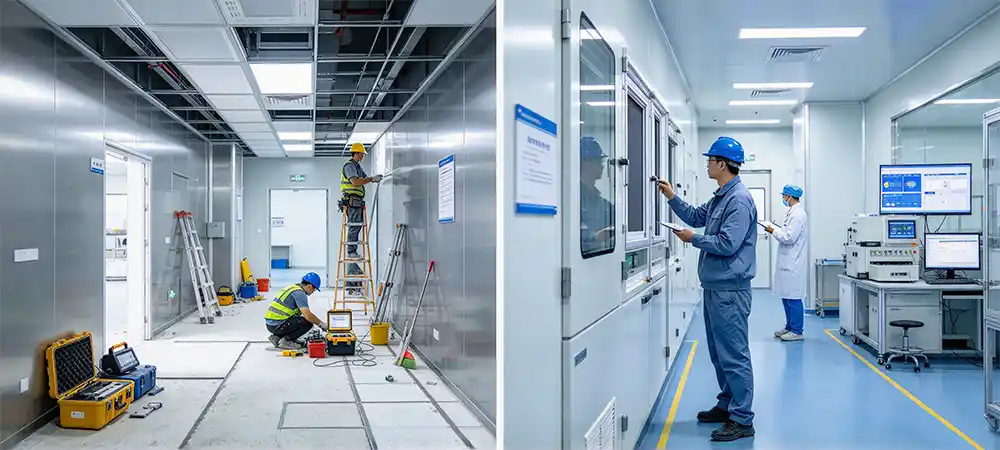
- Periodic validation and TAB — iso 14644 re-certification, airflow balancing, and particle testing are mandatory recurring expenses.
- Unplanned downtime losses — filter failures, pressure excursions, or contamination events halt production and cost far more than the repair itself.
Compliance Downtime Risk
Particles caused by undersized removal of air particulates and poor airflow distribution can result in costs that are far greater than the cost of replacement filtration. Costs for ISO 14644 / GMP re-validation and unplanned production shut downs can cost between $20,000 and $100,000 a day, far exceeding any savings achieved with lower quality initial components.
For a typical 1,000 m² Class 7 pharmaceutical cleanroom, the cost of maintenance can fall between $45,000 and $85,000, depending on the quality of the components and the design of the cleanroom.
Calculating Your ROI: A Data-Driven Approach
To evaluate cleanroom ROI objectively, project owners should model the full cost structure across a 10-year horizon. The typical breakdown of total cleanroom ownership cost is:
20%
Initial CAPEX
50%
Energy Consumption
30%
Maintenance & Repairs
This distribution means energy alone accounts for half of total ownership cost. A 20% reduction in HVAC energy use delivers savings that dwarf any construction-phase discount.
LCC = CAPEX + Σ(Energyyear n + Maintenanceyear n + Downtimeyear n) × Discount Factor
Applying this formula to a $1.8M build with $180k annual energy and $90k annual maintenance yields a 10-year LCC of approximately $4.5M — 2.5 times the initial investment.
10-Year Cleanroom OPEX & ROI Estimator
Estimate your 10-year operational savings with Deiiang low-resistance HVAC and EC FFU technology.
Baseline Annual Energy Cost: $0
Estimated 10-Year Energy Savings: $0
Estimated Payback Period: 0 Years
How Deiiang Engineering Reduces OPEX
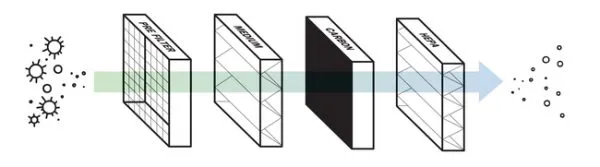
Deiiang™ engineers pursue the design of cleanroom systems where the focus is on the reduction of OPEX, not an afterthought. Ductwork that yields low pressure drops, return grilles with high free area, and filter media with a long life all contribute to the reduction of fan energy and the cost of operations over time.
Under similar conditions of airflow and static pressure, Deiiang’s DC-EC FFU motors use 35% less energy than standard AC motors. Product design by Jason.peng.
Deiiang Energy Efficiency Improvement vs. Standard Models
Additionally, Deiiang’s modular air handling units offer a 15-25 Pa reduction in system static pressure compared to standard builds, due to the use of optimized coil face velocities and low resistance filter tracks. At a flow rate of 30,000 m³/h, a reduction of 10 Pa, results in a savings of approximately 1,200 kWh of consumption.
Rule of Thumb: A reduction in system static pressure of 20 Pa results in a fan energy savings of 5-7% on a continuous basis. When considering an AHU rated at 40,000 m³/h and running at 8,000 hours in a year, the overall savings of energy is between 9,000 and 12,000 kWh on an annual basis.
Airflow Design: The Secret to Energy Savings
The most significant contributor of hidden energy waste in cleanrooms is poor air flow design. When supply air bypasses the work zone completely and short-circuits to the return vents, operators usually raise fan speeds, resulting in higher energy use, and no improvements in cleanliness are realized.
An effective airflow path allows fans to operate at lower static pressures and still achieve cleanrooms operating at the target particulate counts. For a typical cleanroom system of 20,000 m³/h, a reduction of fan pressure from 800 Pa to 600 Pa, represents a savings of more than 18,000 kWh, due to a savings of 25% of shaft power.
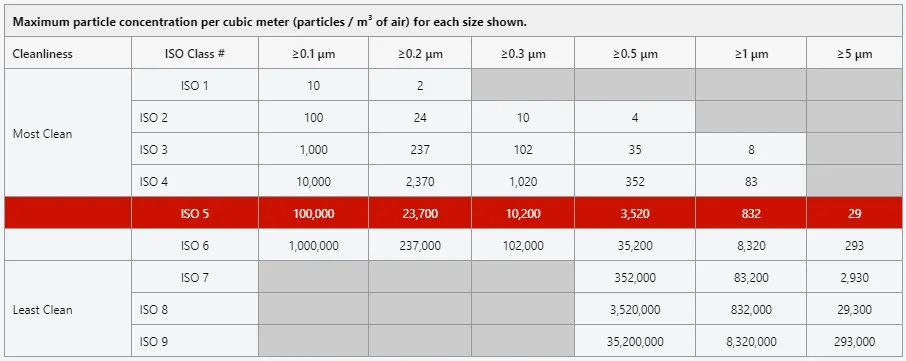
The design of cleanrooms for energy efficiency should comply with the cleanroom standard iso 14644-16 as it is the most globally recognized standard for energy efficiency in cleanrooms, providing for the determination of the minimum level of air changes (ACH) required to meet the cleanliness level in order to eliminate energy inefficient over-ventilation.
Simulations of fluid dynamics analysis during the design process reveal possible dead zones and short circuit paths before the construction begins. This analysis costs, on average, less than 1% of the construction costs. However, it can lead to a 15–20% decrease in energy costs over a 10-year span.
The engineering team analyzes CFD in all of their proposed solutions at Deiiang to keep airflow to the necessary minimum setpoint. This practice avoids a decade of wasted energy due to an over-designed control system.
Deiiang Case Study: Semiconductor Assembly Facility
A Semiconductors assembly facility operating in Southeast Asia used to deploy a 2,200 m² iso class 7 cleanroom and used to incur very high energy costs. The existing system ran 320 FFU units at full speed throughout the year. However, the particle counts were above the acceptable levels near the assembly stations.
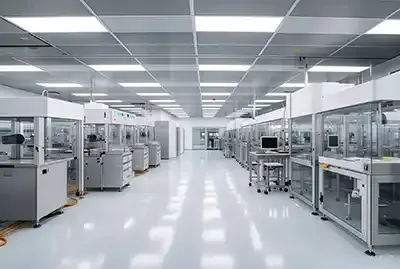
Project overview before optimization
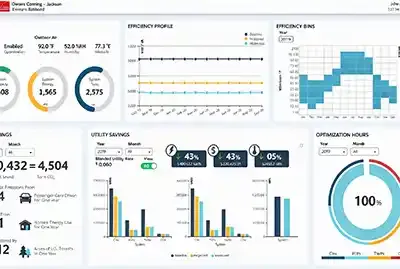
Energy data monitoring panel
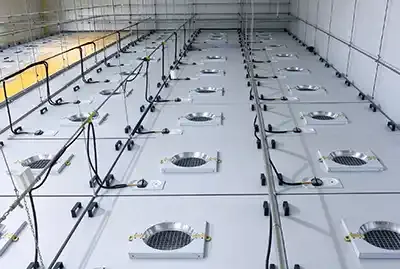
Optimized FFU layout after retrofit
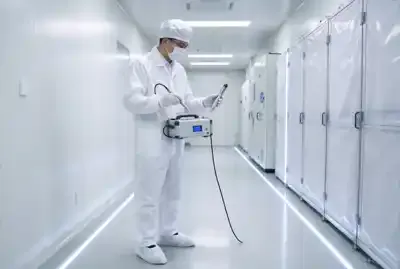
Post-retrofit cleanliness test report
Project challenges:
- Original system consumed 1.2 GWh annually, with FFU units accounting for 62% of cleanroom electricity.
- Pre-filters required replacement every 4 months due to high face velocity and poor pre-filtration staging.
- Particle counts exceeded iso class 7 limits during shift changes, triggering repeated investigations.
- Facility team could not identify which FFU zones were over-supplied versus under-supplied.
Deiiang solution: The engineering team performed a full airflow audit. FFU zones were balanced and upgraded to a DC-EC motor, and real time differential pressure monitoring was implemented. Return air paths were reconfigured to reduce short circuit paths near the assembly equipment of higher heat.
Results: Energy costs dropped by 31% from 1.2 GWh to 0.83 GWh leading to savings of the course of a year that were approximately $44,000 at local electricity rates. The intervals between filter replacements were extended from 4 months to 7 months. Particle counts were under ISO Class 7 limits for all production loads.
ROI Summary: The retrofit cost $128,000. Combined energy and filter savings of $62,000 per year delivered a payback period of 2.1 years, with net 10-year savings exceeding $490,000.
Maintenance Strategies to Extend Cleanroom Lifespan
To decrease the total cost of ownership for maintaining cleanrooms, an improvement in regular maintenance parts is certainly a factor, but Deiiang believes a proactive operational tactic that includes three focal points is the key:
- Real-time differential pressure monitoring — It is important to check the pressure difference on filters and not wait until you check the filters. You can get an extended lifecycle of 20–30% by retiring your filters when a pressure threshold is reached.
- Predictive maintenance over scheduled maintenance — FFU motors can be monitored to predict failure using vibration, current, and air flow sensors. This reduces unplanned downtime by an estimated 60%.
- Adaptive environmental control — It is possible to reduce airflow to a cleanroom based on real-time measurements of room occupancy and air particulate counts. During low-activity periods, reducing airflow by 15% can cut energy use without compromising cleanliness.
Industry Best Practice: Night Setback Mode
Running cleanrooms at full capacity for non-production shifts is a practice that wastes thousands of kWh every month. Night Setback Mode, based on Deiiang’s design, is implemented using variable frequency drives (VFD/EC). The mode can maintain room pressure differentials at the required levels with a 25-30% reduction in airflow after shifts, leading to an additional 12% to 15% reduction in energy costs.
When a facility uses Deiiang strategies, their HEPA filters have 3–5 year service lives and 25% less maintenance costs.
Comparative Analysis: Cheap Build vs. Optimized Build
To illustrate the long-term operation cost difference, the following comparison scores a typical budget cleanroom against a Deiiang-optimized cleanroom across five cost and performance dimensions (1 = poor, 5 = excellent):
Cheap BuildDeiiang Optimized Build
Upfront Cost (lower = better)
5
3
Energy Efficiency
2
5
Filter Service Life
2
4
Cleanliness Stability
2
5
10-Year Total Cost
2
5
| Dimension | Cheap Build | Deiiang Optimized Build |
|---|---|---|
| Upfront CAPEX | Lowest bid, minimal engineering | 10–15% premium, CFD-optimized |
| Annual Energy Cost | High; oversized fans, AC motors | 30–35% lower; EC FFU, low-pressure duct |
| Filter Replacement Cycle | Every 3–4 months (pre-filters) | Every 6–7 months (optimized staging) |
| Cleanliness Stability | Fluctuates under dynamic load | Stable within ISO class, full production |
| 10-Year Total Cost | Highest due to energy + downtime | 25–40% lower total ownership cost |
| Typical Payback of Premium | N/A | 2.0–3.5 years |
| Cheap Build |
|---|
| Upfront CAPEX: Lowest bid |
| Annual Energy: High (AC motors, oversized fans) |
| Filter Cycle: Every 3–4 months |
| Cleanliness: Fluctuates under load |
| 10-Year Cost: Highest |
| Deiiang Optimized Build |
| Upfront CAPEX: 10–15% premium, CFD-optimized |
| Annual Energy: 30–35% lower (EC FFU) |
| Filter Cycle: Every 6–7 months |
| Cleanliness: Stable within ISO class |
| 10-Year Cost: 25–40% lower |
| Payback: 2.0–3.5 years |
The optimized build demonstrates a lower up-front cost and dominates all other metrics for the 10-year total cost of ownership. For facilities that are planning to operate for at least 3 years, the optimized build is the cost-effective option.
Conclusion: Why Optimization Pays Off
Cleanroom optimization should not be perceived as a prefered extra. It is a financial deal structuring imperative. The sooner the investments are made in the design of improved air flow and the procurement of more efficient FFU motors and filters with longer effective working lives, the bigger the cleanroom avoidance, energy, and maintenance cost savings will be over the lifespan of the facility.
For CFOs and facility managers, the analysis is straightforward: cleanrooms that operate for more than 3 years will have a positive cleanroom ROI. If it is to operate for a decade, savings will be greater than the initial cost of the cleanroom.
Deiiang™ goes beyond full life cycle cost modeling and CFD analysis of air flow. We design and build energy optimized FFUs and AHUs, and we have integrated predictive maintenance for our FFUs and AHUs. This helps the clients to make the right decisions based on costs of ownership beyond the first purchase.
Request for a Deiiang life cycle cost analysis for your cleanroom project. Before you make a commitment to a construction budget, you can assess your CAPEX, the 10-year OPEX, and the anticipated ROI.
Recommended Industry Standards & Resources
For additional technical references on cleanroom design, energy efficiency, and validation standards, review the following industry organizations.
References
- iso 14644-1:2015 — Classification of air cleanliness by particle concentration
- iso 14644-3:2019 — Test methods
- ISO 14644-16:2019 — Energy efficiency in cleanrooms
- ASHRAE — HVAC design and energy optimization resources
- IEST — Institute of Environmental Sciences and Technology recommended practices
faq(Frequently Asked Questions)
What do we understand by cleanroom life cycle cost analysis?
Cleanroom life cycle cost analysis is done to estimate all related costs for a specified period which include: Design and construction; Heating, ventilation, and air conditioning and filtration; Energy and water usage; Cleaning and consumable items; Routine maintenance and repair work; Replacing air filters; Certification and recertification of the cleanroom and Amount of downtime; The leftovers at the end of useful life. This approach is a better means of production than only looking at the initial costs alone.
How to calculate cleanroom 10-year lifecycle costs?
A simplified approach to calculation is: 10-year life cycle cost = initial investment + operating costs + maintenance costs + replacement costs + downtimes - the value at the end of useful life. The real calculation should include the future cost adjusted to the present value to take into account the time value of money.
Which part of cleanroom has the highest costs?
Typically HVAC has the highest costs because cleanrooms need filtered air and pressure management, humidity control, temperature control, and constant working hours.
Can more initial investment lead to lower operating costs in ten years?
Yes. You can invest money to put in more efficient fans, use general signals, use better filters, apply more efficient cooling machines, or use better ducts and controls.
What are the implications of using HEPA filters for lifecycle cost?
HEPA filters impact buying and using costs, labor, disposal cost, downtime costs, and fan energy cost. Filters that have a smaller initial resistance can save power, but efficiency, resistance, dust capacity, duration of their use in the cleanroom, compatibility with the cleanroom, and frequency of changing filter must be taken into account when choosing filter.